
From PDFs to Excel: How I Saved Time with Tabula-py
A Fun Little PDF to Excel Scraper
I’m currently on campus over Spring Break and all my friends are either on vacation or back home. I thought that I should use this time wisely and study for the SIE exam or touch up on my IB technicals, which I did. Sort of. While I was recruiting, I bought (overpayed) for Wall Street Prep’s Premium Package. While I was redoing the Financial Statement Modeling module, I was copying and pasting the numbers from Apple’s 2018 10-K into the model and, to be honest, it wasn’t super hard work, but I just found switching windows, copying, pasting, and making sure each line item lined up with the correct numbers so annoying.
…
So, before continuing with the rest of the model, I closed out Excel and fired up VSCode and embracing my laziness and putting the little I got out of my CS degree to work. The painpoint is this: PDFs are used everywhere, but extracting meaningful data from them efficiently can be a challenge. This is especially true for financial statements because they contain a wealth of information about a company and if you don’t have extensions like CapIQ, it can be annoying to scrape the numbers as you build your model.
My solution was to utilize PyPDF2, camelot-py, andtabula-py to find the pages with the relevant information we need and correctly scrape the numbers we need from the documents into an Excel sheet. Let me walk you through how I did it below!
Setup & Installation
With PyPDF2, camelot-py, andtabula-py, we’ll be able to tackle some of the most common tasks and problems that we PDFs present – finding the pages that specific text appears, identifying where a table is on a page, and, taking a table, cleaning the data, and exporting it to Excel.
So, let’s go ahead and install them
pip install PyPDF2 camelot-py tabula-pyUsing PyPDF to Locate Pages with Specific Text
Obviously, this is just implementing ctrl+f. But it’ll be useful later. We will need to utilize PyPDF's PdfReader class to process the 10-K. The logic is simple – for each page, we want to extract the text and see if there’s any text in there that matches what we’re looking for, if so add the index of that page to a list that accumulates the pages where there are matches.
import re
from PyPDF2 import PdfReader

def search_pdf(file_path, search_text):
    with open(file_path, "rb") as file:
        reader = PdfReader(file)
        total_pages = len(reader.pages)
        matched_pages = []

        for page_num in range(total_pages):
            page = reader.pages[page_num]
            page_text = page.extract_text()
            if re.search(search_text.replace(' ','').lower(),
                         page_text.replace(' ','').lower(),
                         flags=re.IGNORECASE):
                # Add 1 as pages are 0-indexed
                matched_pages.append(page_num + 1)

    return matched_pages
So, we’re looking for the financial statement, which Apple’s accountants call “Consolidated Statements of Operations”, then we just do the following
test = search_pdf('aapl10-K.pdf', 'Consolidated Statements of Operations')
test
We’d get
[54, 55, 67, 68, 90, 96, 98, 101, 107]Using Camelot-py to Locate the Tables on a Page
Now we have the page we want to scrape. Continuing to use Apple’s 10-K as an example, we have page 55, at index 54, below.

Before we get to extract the information, we need to identify where the information is. PDFs use a four-point coordinate system: (top, left, bottom, right).
Top is the distance from the top edge of the page to the top edge of the rectangle. In other words, it's the Y-coordinate of the top edge of the rectangular region.
Left is the distance from the left edge of the page to the left edge of the rectangle. In other words, it's the X-coordinate of the left edge of the rectangular region.
Bottom is the distance from the top edge of the page to the bottom edge of the rectangle. In other words, it's the Y-coordinate of the bottom edge of the rectangular region.
Right is the distance from the left edge of the page to the right edge of the rectangle. In other words, it's the X-coordinate of the right edge of the rectangular region.
We can get the coordinates using camelot-py:
import camelot as cm

def extract_table_coords(file_path, page_num):
    tables = cm.read_pdf(file_path, pages=str(page_num), flavor='stream', edge_tol = 50)
    # just see if it was able to capture all the data we want

    coordinates = {}
    if len(tables) > 1:
        # let's take a look at everything camelot picked up
        for i, table in enumerate(tables):
            cm.plot(tables[i], kind='contour').show
            print(f"Area coordinates for table {i}: {[round(num,2) for num in list(table._bbox)]}")
            r,c = tables[i].df.shape
            if c != 1:
                print("more than one table detected")
                coordinates[table.page] = [round(num,2) for num in list(table._bbox)]
            else:
                print("passing")
                continue
    else:
        print("only one table detected")
        cm.plot(tables[0], kind='contour').show()
        for _, table in enumerate(tables):
            coordinates[table.page] = [round(num,2) for num in list(table._bbox)]

    return coordinates
Now, if we give
extract_table_coords('aapl-20210925.pdf', 55)We can get the coordinates of the table on the page and we can see how the library visualizes it:
only one table detected
{55: [25.0, 79.6, 767.44, 484.02]}
As seen above, the package is able to see which information on a page is actually relevant and it cuts out the headers and footers.
There is another case that this function accounts for and that is when there is a lot of text on a page and a table embedded on the same page above or below like in the following Google’s 2021 10-K.

The function accounts for this and only pulls out the bottom table.
extract_table_coords('goog-20211231.pdf', 95)Area coordinates for table 0: [23.91, 322.41, 985.09, 562.03]
passing
Area coordinates for table 1: [24.89, 61.83, 982.48, 247.56]
more than one table detected
{95: [24.89, 61.83, 982.48, 247.56]}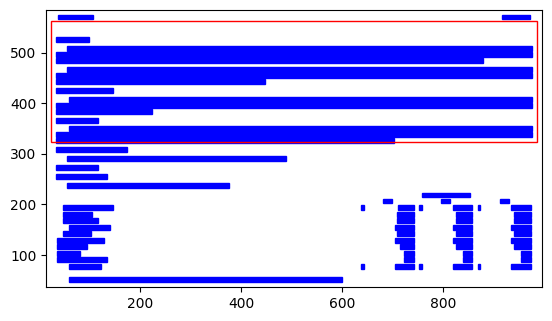

It clearly identifies two chunks that look like tables and shows us that it sees both, but only returns the table with numbers that we want.
Extraction using Tabula-py
With the coordinates, we can use tabula-py to actually extract the numbers and put it into an Excel sheet.
Here’s the code for it:
import tabula as tb
import pandas as pd
from UliPlot.XLSX import auto_adjust_xlsx_column_width
from xlsxwriter.workbook import Workbook

def area_scraper(top, left, width, height, page_number, file_path):
    bottom = top + height
    right = left + width
    area = [top, left, bottom, right]
    table = tb.read_pdf(file_path, pages = [page_number], area = [area], stream = True)[0]
    table.dropna(thresh=len(table.index)/2, axis=1, inplace=True)
    newIndex = table.columns[0]
    table = table.set_index(newIndex)
    table.index.names = [None]
    table = table[table.index.notnull()]
    table = table.replace(',','', regex=True)
    table= table.replace('\$|,','', regex=True)
    table = table.replace(to_replace='\(', value="-", regex=True).replace('\)','', regex = True)
    table = table.applymap(pd.to_numeric, errors="ignore")
    table = table.rename(columns={x: f"Period {y}" for x, y in zip(table.columns, range(0, len(table.columns)))})
    return table
The area_scraper function takes in the coordinates of the table, the page number the table is found on, and the path of the file that we’re working with. The comments adequately explain the logic and issues we face when scraping the numbers into a pandas dataframe.
Going back to Apple’s 10-K that we were originally working with, here’s the output of page 55 compared to the page:
area_scraper(123.13,23.55,738.83,408.59, 55,'aapl-20210925.pdf')
Just what we’re looking for!
Now, it’s just a simple matter of exporting it to an Excel file using the following code:
def saveAsExcel(outputName, df):
    # Create a Pandas Excel writer using XlsxWriter as the engine.
    writer = pd.ExcelWriter(outputName, engine='xlsxwriter')

    # Convert the dataframe to an XlsxWriter Excel object.
    df.to_excel(writer, sheet_name='Sheet1')

    # Get the xlsxwriter workbook and worksheet objects.
    workbook  = writer.book
    worksheet = writer.sheets['Sheet1']

    # Add some cell formats.
    numericalFormat = workbook.add_format({'num_format': '#,##0.00;(#,##0.00)'})

    indexFormat = workbook.add_format()
    indexFormat.set_align('left')

    # Set the column width and format.
    worksheet.set_column(1, len(df.columns), None, numericalFormat)
    worksheet.set_column(0,0, None, indexFormat)
    auto_adjust_xlsx_column_width(df, writer, sheet_name="Sheet1", margin=0)

    # Close the Pandas Excel writer and output the Excel file.
    writer.close()
saveAsExcel('output.xlsx',incomeStatement)